What a Mortgage Payment Actually Cost
Modeled monthly payments on the median new home, 1965 to 2026, in September 2026 dollars.
It's a common claim that "housing prices have been rising for a generation". The reality is more complicated than that.
In reality, a typical household budget is almost entirely dictated by the monthly payment spent on housing. The total sale price of a house only shows up on the day you buy and the day you sell, but means very little to the average monthly budget and quality of life. The mortgage payment sets what a family has left for everything else it wants to buy or do.
By that measure, the 2010s were the cheapest calendar decade to buy a home in more than two generations, and the cheap run lasted through 2021. The eighties, the decade everyone remembers as cheap, hold the two most expensive years on record, and their houses were smaller.
In 1981 the median new home in the United States sold for $68,900. In 2021 it sold for $383,500. Converted to today's dollars, the 1981 house cost about $255,000, a little more than half the 2021 house at $476,867. It was also smaller: 1,560 square feet against 2,315. Now put 20% down on each, take a 30-year loan at that year's median rate, and convert the payment to September 2026 dollars. The 1981 buyer paid $2,872 a month in principal and interest, the highest of any year in a record that runs back to 1965. The 2021 buyer paid $1,603. About half the price, two-thirds the floor space, and nearly 80% more a month. The interest rate made the difference, and it left the 1981 buyer with $1,269 a month less, in today's dollars, for everything else.
The gap holds well beyond that pair. A 2021 buyer paid less each month than a buyer in any year from 1976 through 2008. The cheap eighties are a memory of sticker prices.
These are modeled principal and interest payments for a new purchase each year on the national median new home, not the leftover cash of one continuing household. The national median shows the broad U.S. pattern; local markets can look very different.
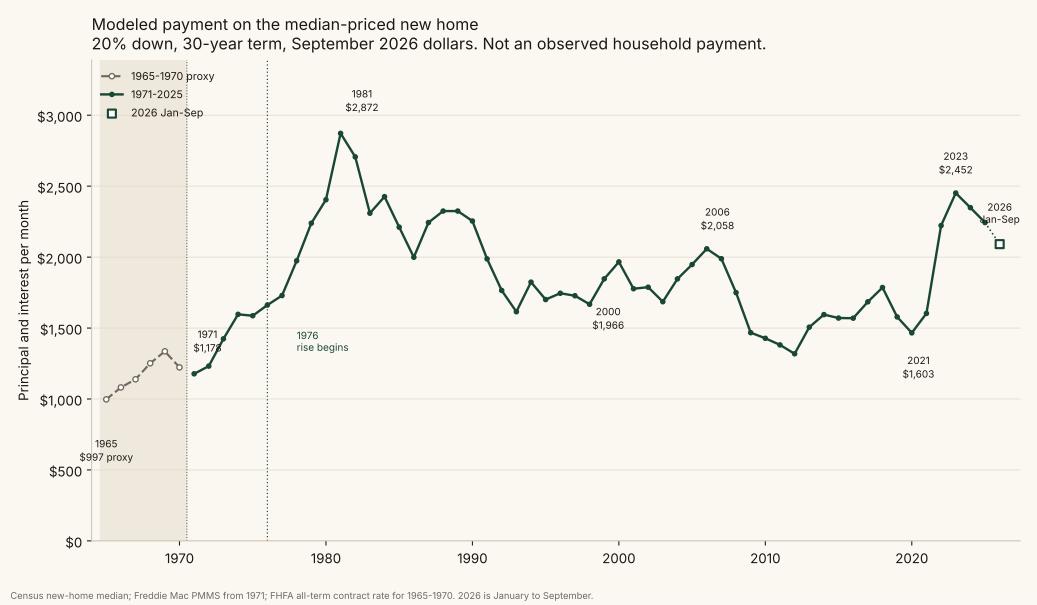
The chart keeps the whole span, from 1965 through the partial 2026 reading. Callout peaks mark a completed year whose modeled real payment is the highest within five years on either side. 2026 cannot qualify, because the year is incomplete. Adjacent years in one surge count once: 1980 sits inside the window around 1981, so only 1981 is marked. The four peaks are 1981 ($2,872), 2000 ($1,966), 2006 ($2,058), and 2023 ($2,452). They are highs of their own neighborhoods, not a ranking of the four largest payments in the file. 1982, at $2,706, is the second-highest year, and it belongs to the 1981 episode.
Scroll the table sideways for the notes.
| Year | Real monthly P&I | Why it is marked |
|---|---|---|
| 1981 | $2,872 | Highest within five years, and the highest year in the file. Rate 16.76%. |
| 2000 | $1,966 | Highest from 1995 through 2005. A local peak, far under 1981. |
| 2006 | $2,058 | Highest from 2001 through 2011. |
| 2023 | $2,452 | Highest from 2018 through the partial 2026 reading. The post-2021 spike. |
| 1965 | $997 | Lowest year in the file. FHFA proxy, not a 30-year median. |
| 1971 | $1,178 | Lowest year on the Freddie Mac series, the comparable 30-year measure. |
| 2012 | $1,319 | Lowest Freddie Mac year after 1972. |
| 2017 | $1,685 | Often remembered with 2021; higher than 2021, and not a series low. |
| 2021 | $1,603 | Cheaper than every year from 1976 through 2008; not the series minimum. |
Two generations, starting in 1976
The long comparison in this essay starts in 1976, not because that year is a peak, and not because the data begin there. The series high is 1981. Walking backward from that high, the modeled real payment rises in every year from 1976 through 1981, from $1,662 to $2,872. The year before that run, 1975, was a small step down after the step up in 1973 and 1974. 1975 is the pause before the climb. It is not the start, and it is not a peak chosen to make the later years look calm.
1976 to 2026 is fifty years, about two generations. The headline chart still shows 1965 to 1975, including the cheaper proxy years. The line at 1976 only marks where that climb begins.
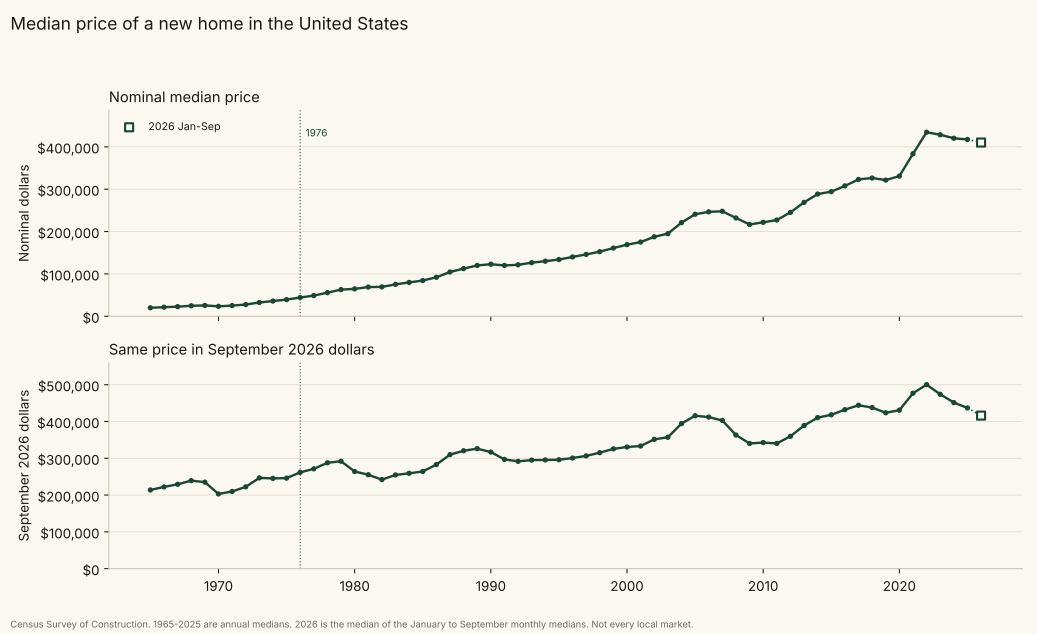
Over those fifty years the sticker price rose more than the monthly payment. The path of the payment was not flat. In September 2026 dollars the median new home went from $261,697 in 1976 to $476,867 in 2021, up 82%, while the modeled payment went from $1,662 to $1,603. Through the partial 2026 reading the real price is $416,000, up 59% from 1976, and the real payment is $2,092, up 26%. In nominal dollars the price went from $44,200 to $410,200, and the payment went from $281 to $2,062.
The exceptions are visible on the chart. By 1981 the real payment was about 73% above 1976, while the real sticker was slightly lower than in 1976. That is the part the cheap-eighties story skips: the sticker barely moved, and the payment climbed 73%. After 2021 the real payment jumped again, to $2,452 in 2023, while the real sticker did not. A comparison that starts in the mid-1970s and stops in 2021 can look quiet. The years between those endpoints were not.
Scroll the table sideways for the payment and down payment columns.
| Year | Median new home | 30-yr rate | Monthly P&I (nominal) | Monthly P&I (Sep 2026 $) | 20% down (Sep 2026 $) |
|---|---|---|---|---|---|
| 1970 | $23,400 | 8.27%* | $141 | $1,223* | $40,615 |
| 1980 | $64,600 | 13.41% | $588 | $2,405 | $52,826 |
| 2000 | $169,000 | 8.14% | $1,005 | $1,966 | $66,136 |
| 2021 | $383,500 | 2.98% | $1,289 | $1,603 | $95,373 |
| 2026 (Jan to Sep) | $410,200 | 6.45% | $2,062 | $2,092 | $83,200 |
*1970 uses a different rate series. The Freddie Mac survey starts in 1971, so 1965 to 1970 use the federal housing regulator's average contract rate on new-home loans closed. That series is an annual average on loans of all terms. It is not a 30-year median. It is close to Freddie Mac in the early 1970s, and it is not the same measure, so treat those years as approximate.
The down payment concession
The cheap-eighties story does have one solid leg, and it deserves its due. In real terms the 20% down payment roughly doubled, from about $41,000 in 1970 to about $95,000 in 2021 and $100,000 in 2022. The 1980 buyer needed about $53,000 in today's dollars to put 20% down, a little over half what the 2021 buyer needed. That is a real barrier, and it is where the low sticker prices of the eighties actually helped.
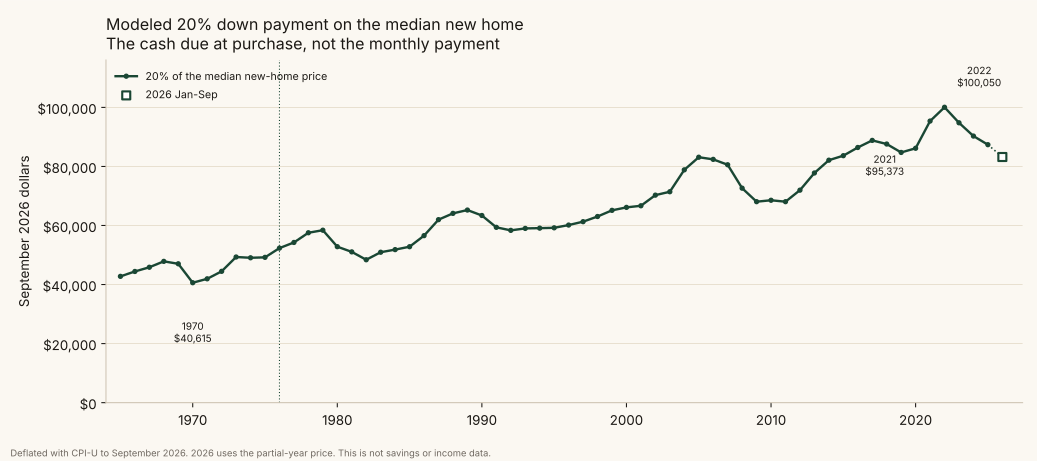
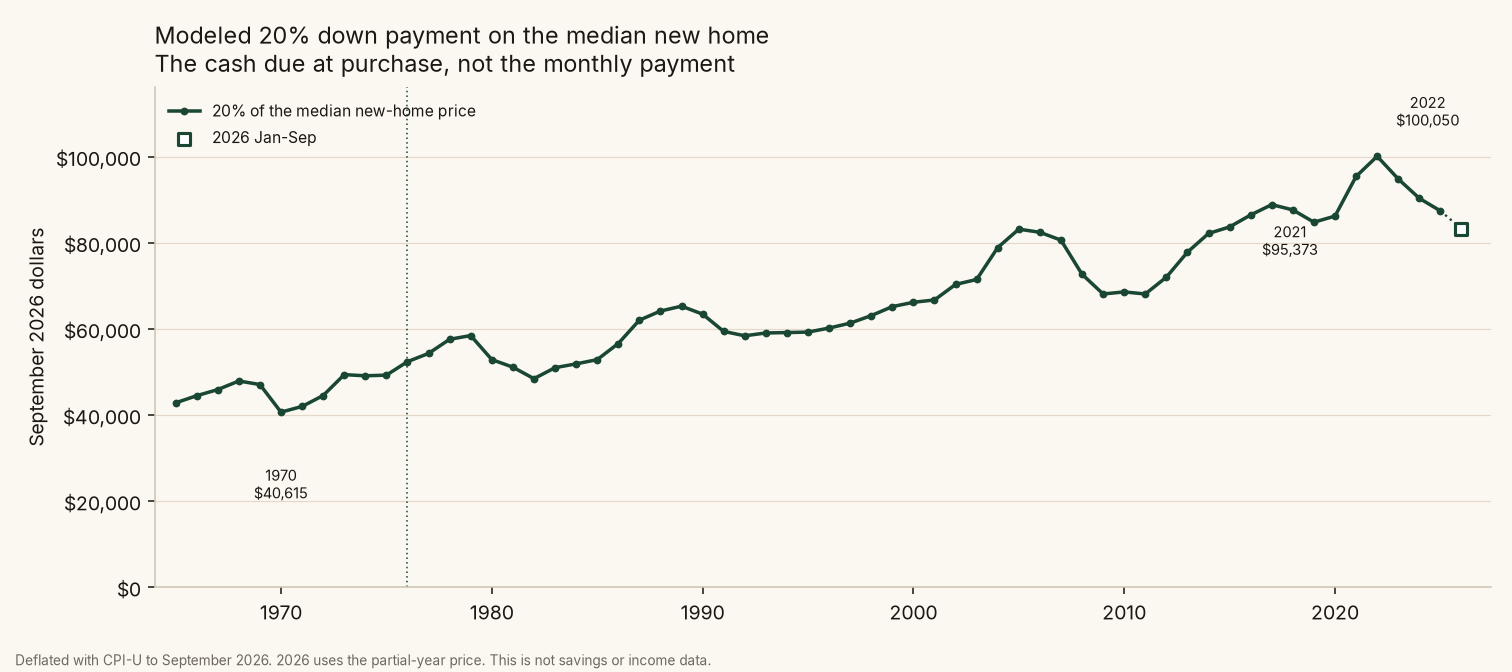
One way to think about it: lenders and households tend to size a purchase around a monthly payment, so a bigger down payment may mostly show up as more years of saving before the first purchase, rather than as a bigger monthly budget afterward. That is a plausible hypothesis, not a finding of this dataset. Testing it would need data on income, savings rates, and age at first purchase. It also is not the only cost: money tied up in a down payment has an opportunity cost, and buyers who can save it are not a random slice of households, which skews who shows up in the numbers.
More house for the payment
The comparison so far understates the gap, because the houses were not the same size. The median new single-family home sold in 1981 had 1,560 square feet of floor area. In 2021 it had 2,315, about 48% more. The median peaked at 2,526 square feet in 2014 and has since slipped to 2,194 in 2025, still well above any year of the eighties.
Divide the monthly payment by the floor area and the eighties look worse still.
| Year | Median square feet | Real monthly P&I | Per square foot |
|---|---|---|---|
| 1981 | 1,560 | $2,872 | $1.84 |
| 2021 | 2,315 | $1,603 | $0.69 |
| 2023 | 2,286 | $2,452 | $1.07 |
Per square foot, the 1981 buyer paid about 2.7 times as much each month as the 2021 buyer. Even 2023, the peak of the post-COVID spike, came in 42% below 1981. These are ratios of two separate medians, not the payment on one particular house, so read them as a guide to scale. A bigger house also costs more to heat, insure, and tax, and this payment leaves those out.
What the curve shows
- The series high is 1981, $2,872 a month in today's dollars, with a median rate of 16.76%. 1982 ($2,706) is the next year of that same spike. 2023 ($2,452) is the next neighborhood peak, and the highest year since 1984.
- On the Freddie Mac series, the cheap end is 1971 ($1,178) and 1972 ($1,232), then 2012 ($1,319) and 2011 ($1,381). The 1965 proxy figure ($997) is lower still, and it is labeled as a proxy.
- From 2021 to 2022 the real payment rose from $1,603 to $2,222, about 39%, and it reached $2,452 in 2023. The partial 2026 reading is $2,092.
The 1981 spike
The highest point on the chart came from rates more than prices. The median Freddie Mac rate went from 8.89% in 1977 to 16.76% in 1981, as the Federal Reserve tightened hard against inflation (Federal Reserve History, "The Great Inflation"). Over the same years the median new home rose from $48,800 to $68,900, about 41%. But the monthly principal and interest on that home went from $311 to $775, about 2.5 times as much, or from $1,729 to $2,872 in today's dollars.
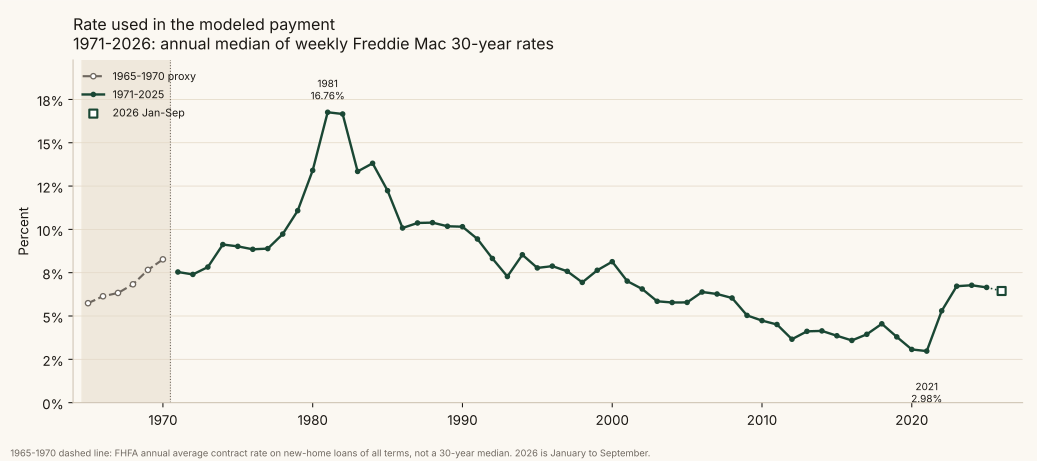
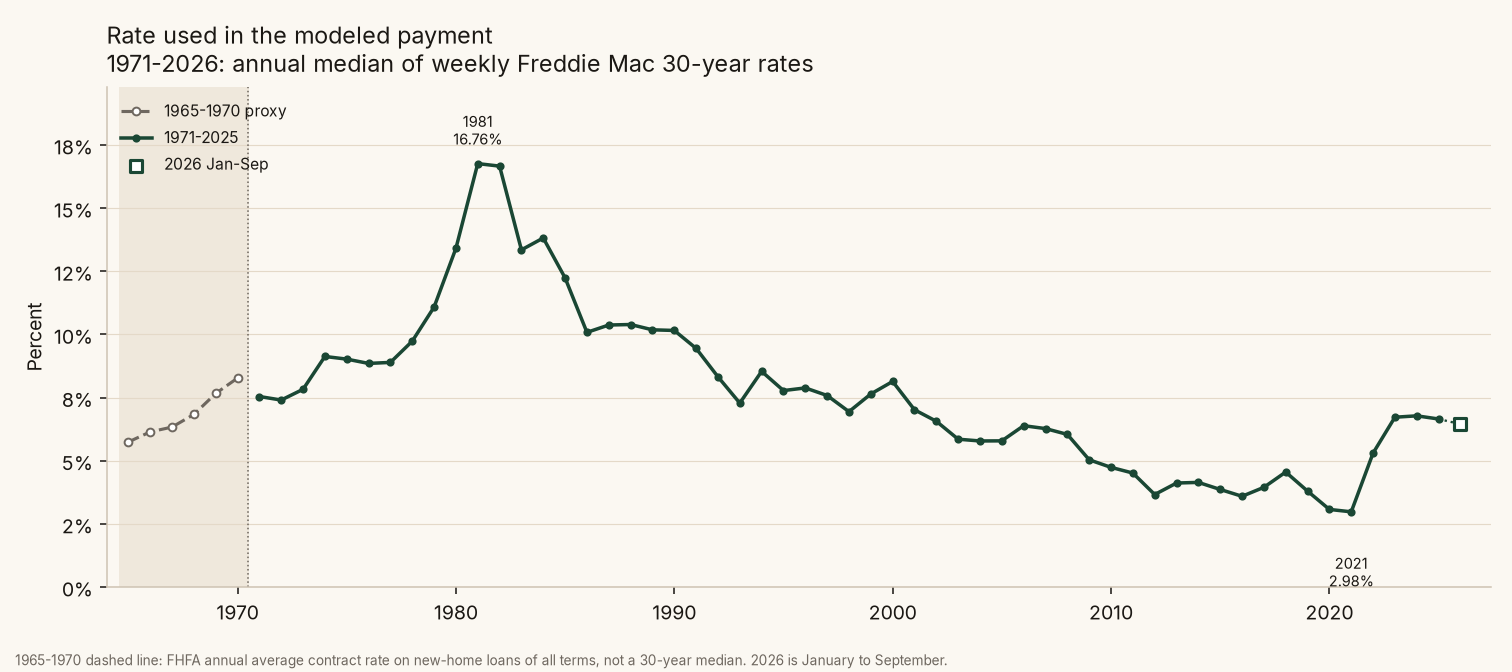
That was a heavy monthly cash commitment, and it put real strain on the budgets of people buying or refinancing then. It applies to new purchases and new loans only. A household that had locked in a fixed rate in the 1960s or early 1970s kept its old payment, and inflation made that payment cheaper every year. That is one plausible source of the cheap-eighties memory: the people who already owned had it cheap, and the people buying did not. This dataset does not show what share of income the 1981 payment took, because it uses no income data.
More than one good year
Any single year can be a fluke, so it helps to average. On the Freddie Mac series, using real monthly payments:
| Window | Average real payment |
|---|---|
| 2017 to 2021 | $1,624 |
| 2011 to 2021 | $1,551 |
| 2009 to 2013 | $1,420 |
| 1971 to 1975 | $1,403 |
| 2022 to 2026 (2026 is Jan to Sep) | $2,272 |
Among all 52 rolling five-year windows, 1971 to 1975 is the cheapest and 2009 to 2013 is next. 2017 to 2021 ranks 12th. Among all 46 rolling eleven-year windows, 2010 to 2020 is the cheapest, and 2011 to 2021 ranks 4th. On calendar decades, 2010 through 2019 averages $1,542 a month, the lowest complete decade on the Freddie Mac series since it began in 1971. 2017 itself was not a cheap single year, and 2021 was not the best single year.
What if buyers choose smaller down payments?
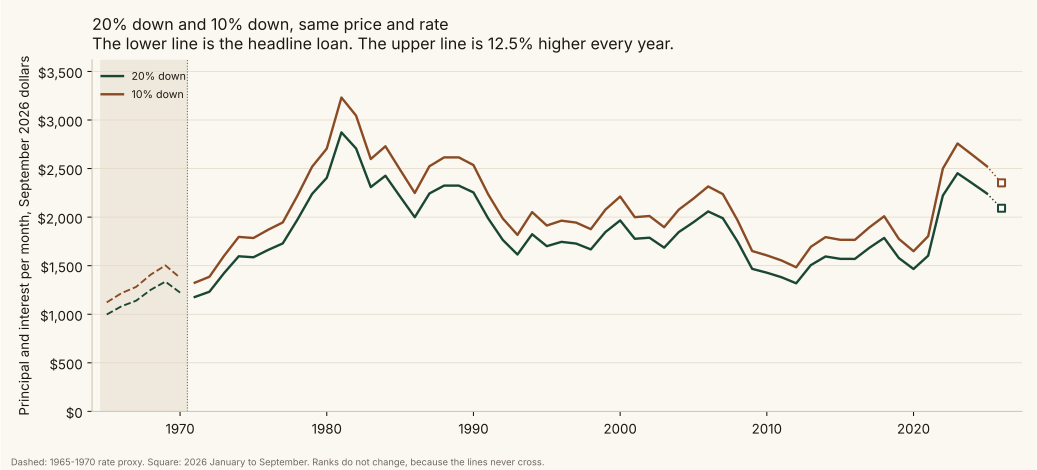
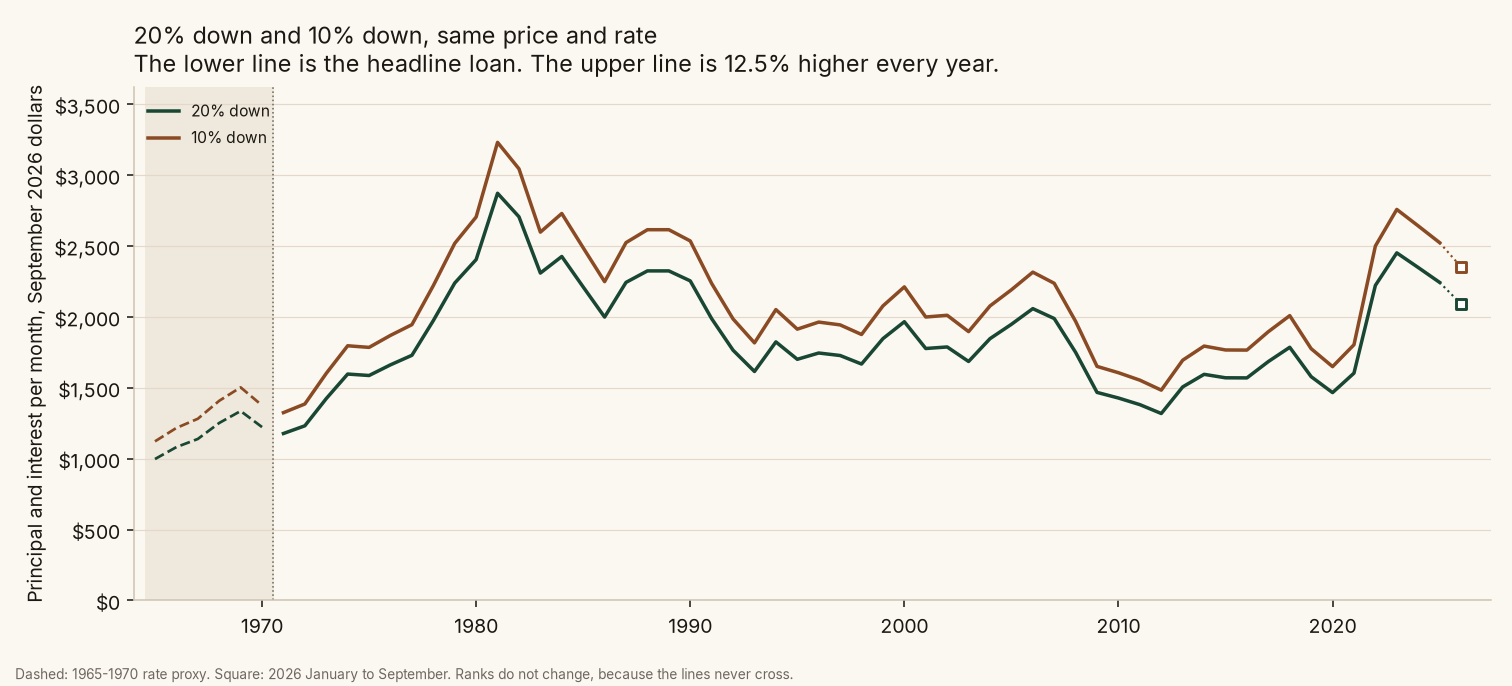
The pattern does not depend on the 20% assumption. Holding 10% down constant across the whole span raises every payment by the same 12.5%. In today's dollars, 2021 becomes $1,804, 1981 becomes $3,231, and 2026 so far becomes $2,353. The rankings do not change, because the two lines never cross.
That illustration is not a full FHA-style cost picture. Low-down-payment loans usually carry mortgage insurance, which this series leaves out, so the true monthly gap versus 20% down would be wider than the principal-and-interest difference alone.
The post-COVID concession
Whatever the long record shows, the people buying now are not imagining things. The real payment jumped about 39% from 2021 to 2022 and peaked at $2,452 in 2023. Only 1981 and 1982 were higher. A 2023 buyer paid more each month than a 1980 buyer. Prices rose quickly in 2020 to 2022, and then rates roughly doubled, so a buyer in 2023 got both. Owners who locked in a low rate in 2020 or 2021 kept their payments, the same split between old and new borrowers that showed up in 1981.
Longer loan terms
Longer or interest-only loans do not make the recent gap go away. These are same-rate hypotheticals on each year's own price, with 20% down. They are not priced as typical products: 40-year and interest-only loans are generally not qualified mortgages, and stretching the term usually means more interest paid over the life of the loan.
Using 2026 so far (6.445%, 80% of a $410,200 home), in today's dollars:
| Loan structure | 2021 | 2026 (Jan to Sep) |
|---|---|---|
| 30-year amortizing | $1,603 | $2,092 |
| 40-year amortizing | $1,360 | $1,935 |
| Interest only (no principal repaid) | $946 | $1,787 |
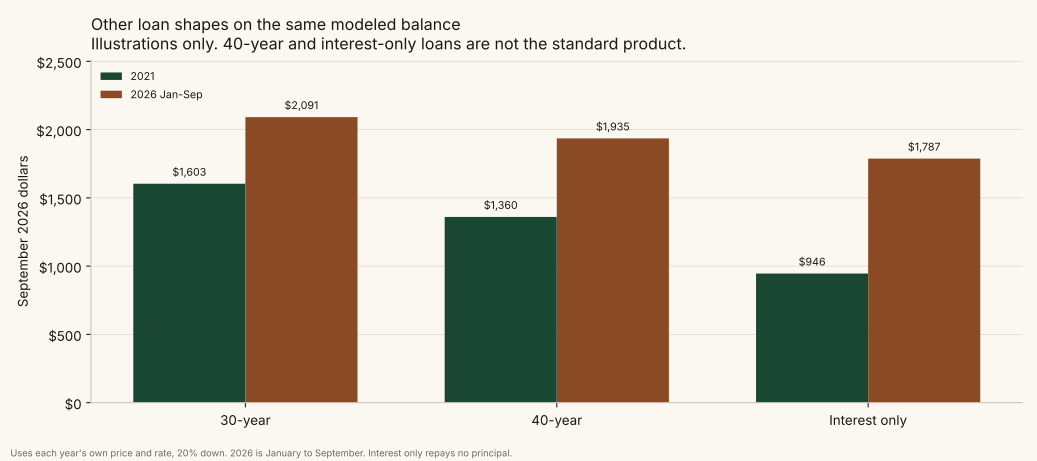
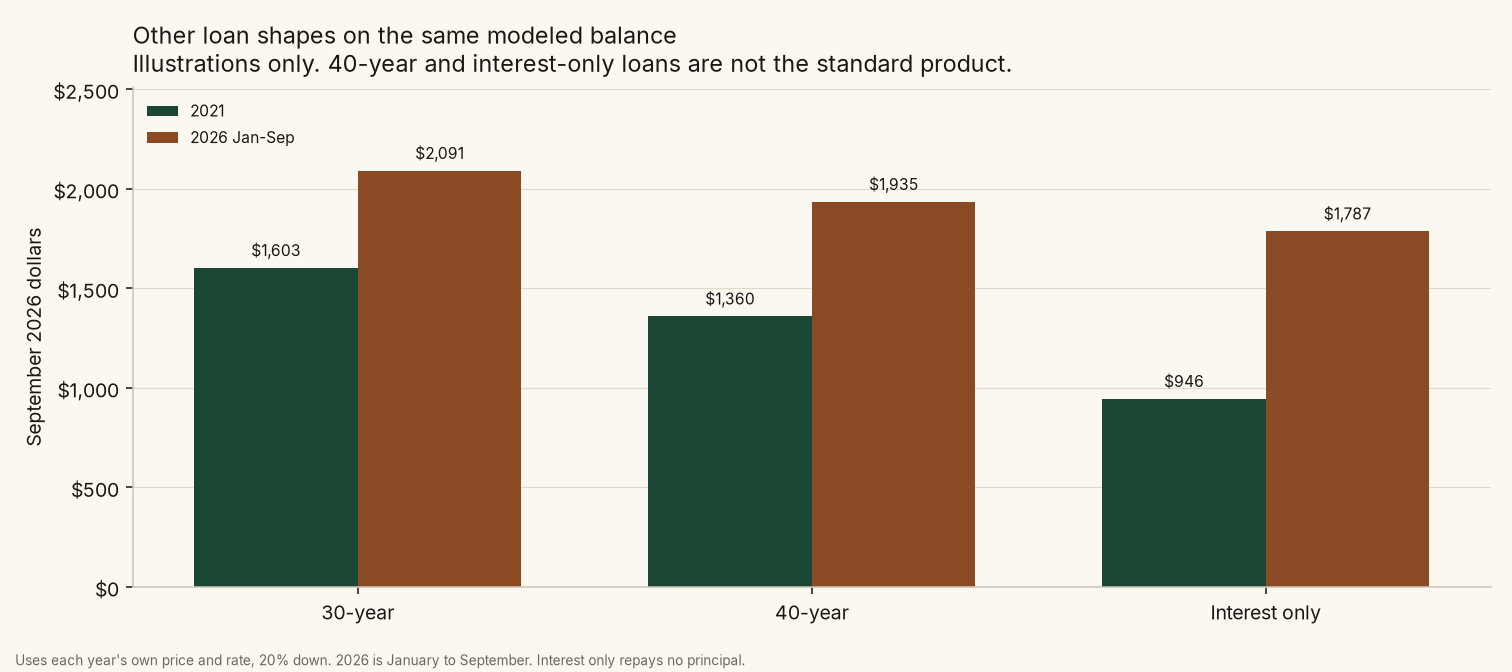
At today's rates even an interest-only loan, which makes no scheduled principal reduction (home-price appreciation can still raise equity), costs more each month than a normal 30-year loan did in 2021. Stretching the term helps less when rates are high, because more of each payment is interest.
Was 2021 the most affordable year?
On payment alone, no. 2021 had the lowest median rate on record (2.975%), but prices had already climbed, so its real payment of $1,603 is not the minimum on the Freddie Mac series. 2012 was cheaper, and so were several other years in the 2010s and the early 1970s. Low rates and low payments are not the same thing, and neither one is affordability, which depends on income.
What 2021 does have is distance from the years people call cheap. Its payment was 44% below 1981 and below every year from 1976 through 2008. The eighties had low sticker prices. Every year of that decade had a higher monthly payment than 2021.
What this does not measure
This is the principal and interest payment only. It leaves out taxes, insurance, maintenance, closing costs, and the down payment itself. It uses new homes, which have gotten bigger over time. And it says nothing about income: a payment is only affordable relative to what people earn, which is the next piece of the analysis.
Data: Census New Residential Sales, Census Characteristics of New Housing (floor area of new single-family houses sold), Freddie Mac PMMS, BLS CPI-U. Full dataset and method in the accompanying CSV and notes. 2026 is January to September, and its price is the median of the monthly Census figures. 1965 to 1970 rates are a proxy series.
Other tables from the same build: window averages, rolling windows, loan structures, and the 1971 to 1985 proxy overlap check.